Discover how our Network Inventory System empowers telecom network management
The NetStork application facilitates the modeling and management of fiber, coax, and copper networks along with their topologies. Our tool facilitates seamless access and updates to network data, whether in the field or at the office. Data storage options include a relational database accessible organization-wide or locally on devices via XML files, ensuring operational continuity in both online and offline modes.
Model your network and access crucial data through an intuitive graphic interface. Create network inventory using graphic elements, instantly verifying results. Eliminate the need to toggle between app windows and fill out forms or charts, ensuring ongoing progress remains under your control.
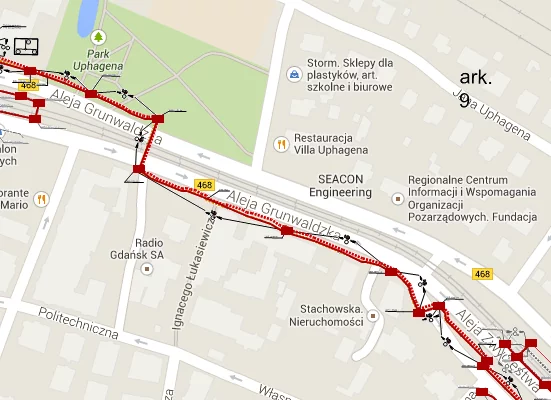
Add new cable chambers, racks, or buildings directly on a map. Simply point to a location using your mouse and click for the desired object to appear. The system ensures that modeled connections adhere to network technology standards.
Use NetStork to model your entire telecommunications network:
Infrastructure
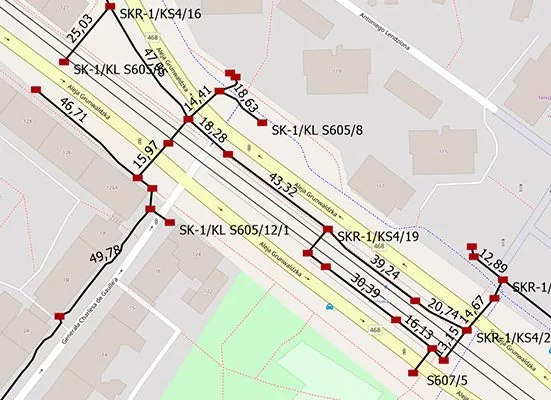
Cable duct routing, microducts, cable chambers, racks, underground utility boxes, poles, antennas, and their reach, among others.
Connections
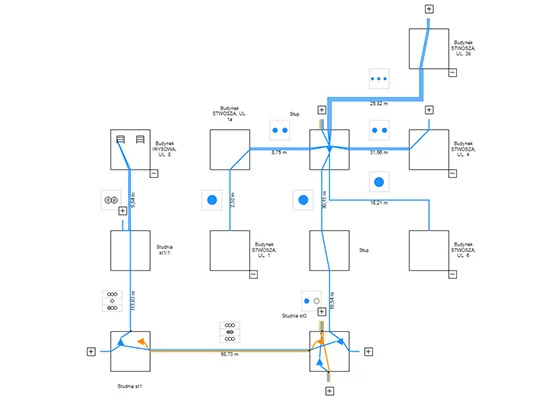
Logical connections of buildings and clients within the network, visualizations of fiber occupancy in every node.
Inside Plant Inventory
Network schemes overlaid on building floor plans, simplified modeling of building structures with connection visualizations.
Network Resources
Various network technologies such as GPON (FFTx), copper, radio, ethernet, and HFC.
Basic features
- Network Schemes
- Planning and Management
- Fieldwork
- Data Loading
- Background Maps
- Reflectometer Analysis and Outage Location
- WEB Interface
Network Schemes
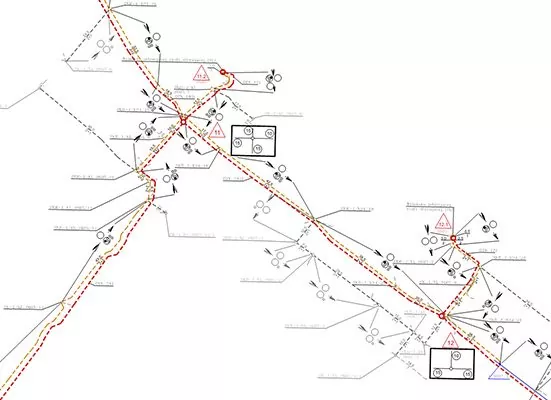
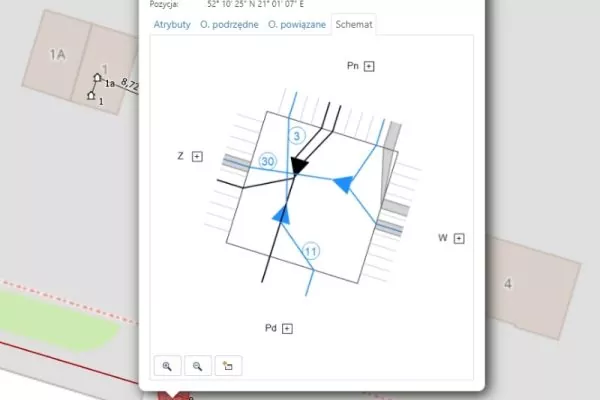
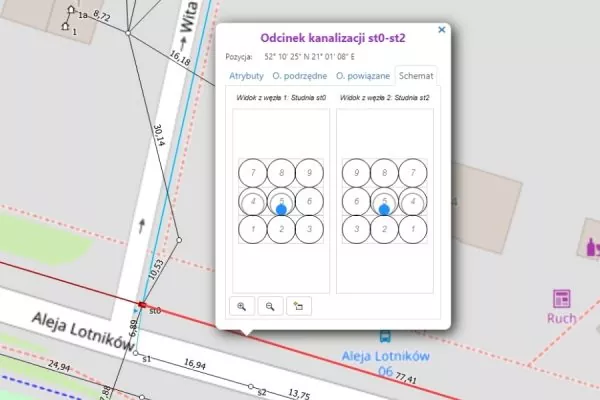
NetStork generates schemes visualizing your network in various contexts and levels of detail. These schemes are readily available and retain changes without regeneration. Edit objects by combining and altering their attributes and positions.
NetStork excels in generating schemes that visualize your network across diverse contexts and levels of detail. These schemes are instantly accessible and retain modifications seamlessly, eliminating the need for repetitive generation. Leveraging these schemes, you can effectively model your network, seamlessly editing objects by combining them and adjusting their attributes and positions.
Network Planning and Management
Create and update network plans and projects during construction, generating documentation without data transfer post-construction.
You can:
- separate network fragments,
- combine project tasks with existing database networks,
- style networks by status
- print projects with regulatory notes.

Fieldwork
Support fieldwork during inventory and maintenance with tablet mode, adapted for finger or stylus use. Utilize GPS for object coordinates retrieval and synchronize data across devices into a joint database.
You can synchronize data from various devices into a unified database. By establishing a connection to the database, you can seamlessly work on it directly while in the field, ensuring real-time access to crucial information.

Data Loading
NetStork seamlessly imports data from DWG/DXF documentation or via a CSV data loader.
Loading DWG/DXF data is effortless; there’s no need to navigate complex file structures. Simply point to the object on the DWG or DXF background map, and NetStork intelligently recognizes the layer, displaying elements along with their names. This functionality enables the easy loading and positioning of external network objects on a map.
Meanwhile, the CSV loader allows you to load various network objects, including internal ones, along with their attributes. This capability facilitates the smooth transition of data from other network inventory systems or the complete loading of a network into an empty database.
Background Maps
NetStork provides seamless integration with WMS and WMTS map services. While Open Street Maps serves as the default map source, the system offers the flexibility to connect to any local map service. Beyond online services, NetStork supports the connection and display of maps in diverse formats, including DWG/DXF (AutoCAD), SHP (ESRI Shapefile), JPG, and PNG.

Reflectometer Analysis and Outage Location
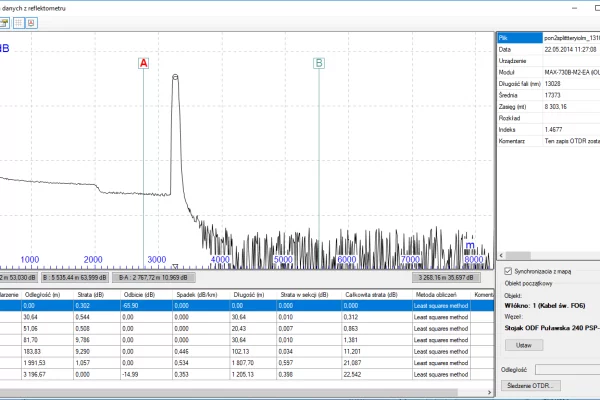
NetStork interprets reflectometer (OTDR) measurement files, leveraging the data to pinpoint critical network locations.
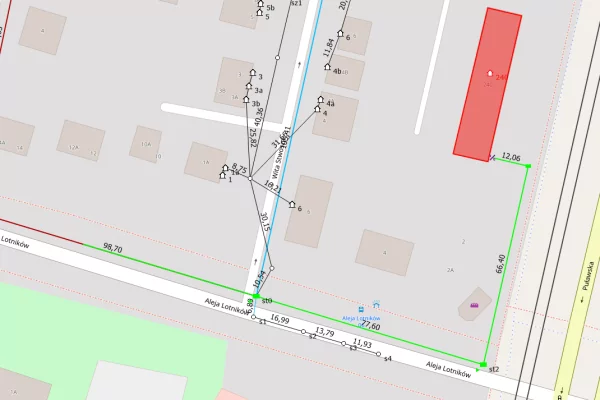
By selecting a point on the measurement chart, the program instantly identifies the corresponding location. The distance between these points is highlighted in green, providing clear visual cues for efficient network analysis.
WEB Interface
Use our web access feature if your organization requires broader access to network data. This functionality allows sales personnel, technicians, and other stakeholders to effortlessly view data, display network schemes, and observe network connections from their tablets or smartphones.
Explore other ways NetStork supports your Network Inventory process
NetStork’s interface streamlines data entry and enhances fieldwork intuitiveness. It boasts an intelligent hint system, providing users with prompts regarding the next operation to execute. These hints are tailored to specific network elements (dictionaries), simplifying user interactions. In many cases, users only need to approve the operations suggested by the app, further streamlining workflow efficiency.
Within the system, you can attach documents or photos captured during network maintenance directly to network elements. The application continuously monitors the accuracy of entered objects, allowing users to verify the integrity of the entire database or specific segments.
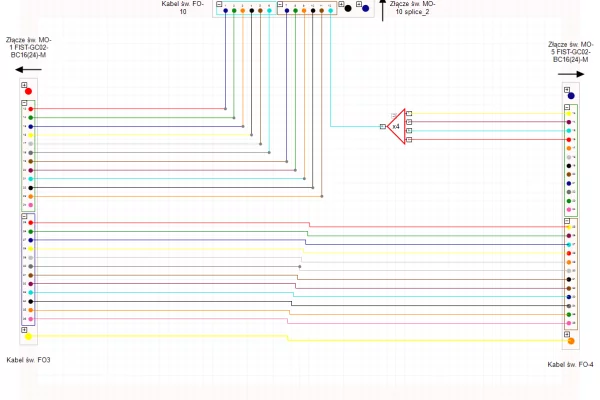
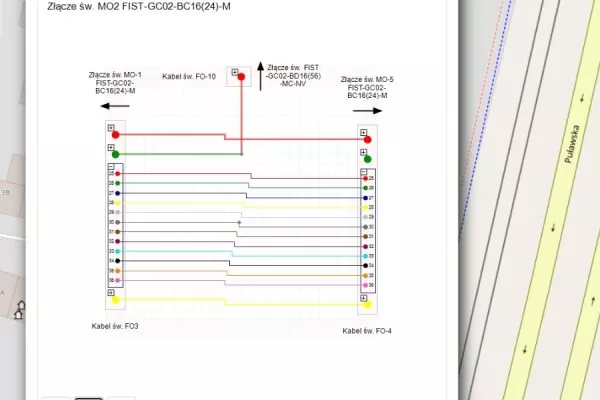
NetStork enables graphical modeling of fiber connections within optical connectors and between patch panel ports. Leveraging your network model, you can generate logical network schemes at both fiber and cable levels.
In NetStork, importing raster and vector data in the DXF format is seamless. Additionally, you can easily access and display data from public WMS/WMTS map services, such as OpenStreetMap. With the integrated GPS, effortlessly position objects based on their coordinates and track the routes of field crew members.

