
NetStork supports you throughout the full lifecycle of your network. You can use it to model an existing network infrastructure and design a new one. Learn more about the process and benefits of designing your network directly in the NI system.
Each network, even the largest one, started with plans and a few lines in the designer’s computer. This is an essential stage during which an analysis of the future project is created. Before the business starts, specialists must answer many questions:
- Where are the potential customers?
- Whose network is already available in the area?
- How do you deliver services as quickly as possible?
- Is it better to build your own network from scratch or lease it from other operators?
Data on the networks and infrastructure of other operators is also an additional, valuable source of information.
From a plan to a project
Planning is important, but it is only the first stage in the construction of a telecommunications network. It is immediately followed by the design stage.
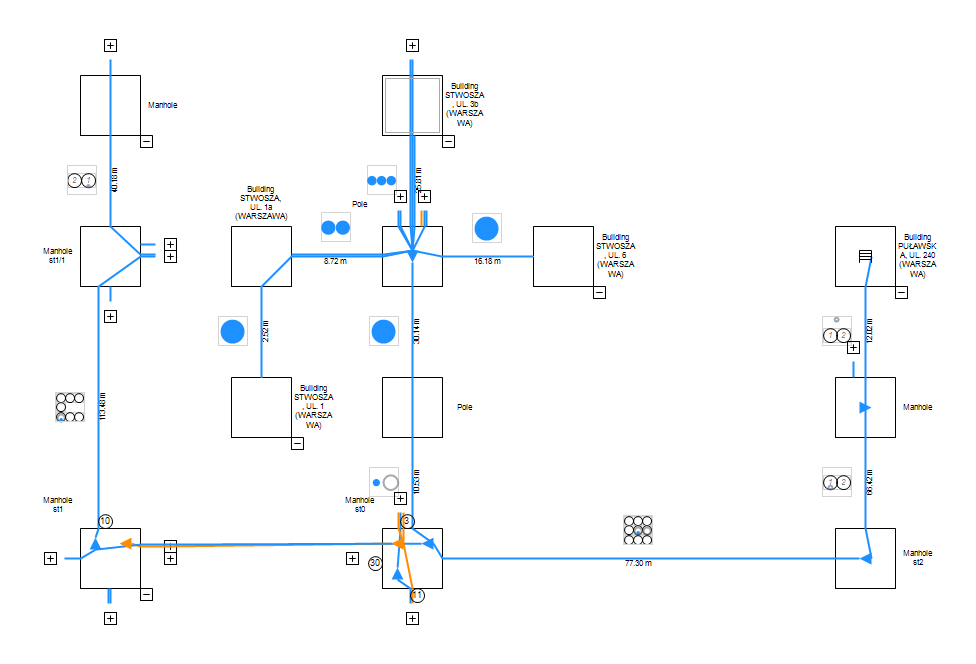
The modeling of the network’s route begins. First, it’s modeled on a map and takes the already existing infrastructure into account: the network that we are developing, the networks of other operators (or our competitors) that we will use, and the networks of other industries must all be included.
Data on external networks can come in several forms:
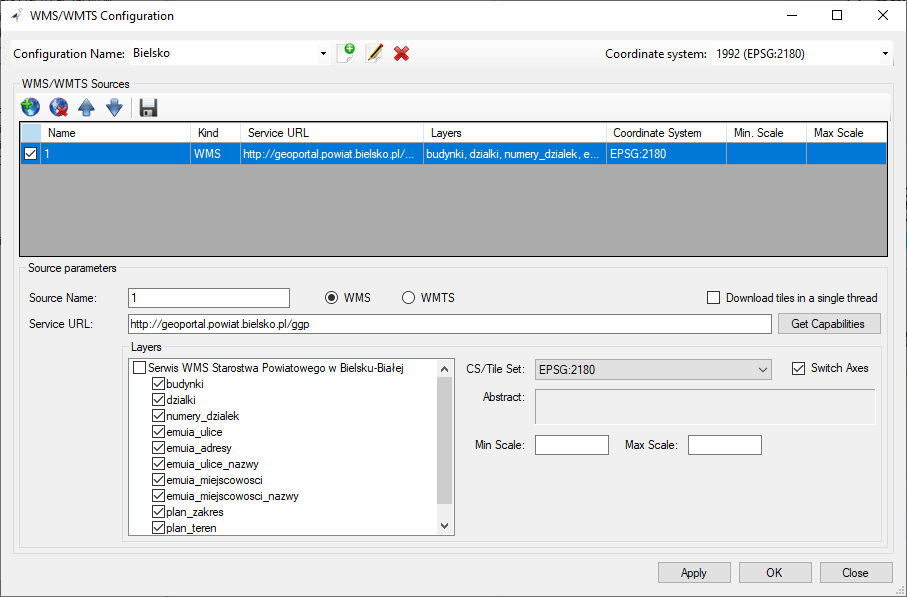
- WMS/WMTS source: then you can connect to the program as a map background using the “WMS/WMTS Configuration” function. If the map has multiple layers, they can be switched off or on according to the project needs.
- DWG\DXF\SHP vector files or raster files, connected as a map background. A new network project is created in this background.
- Data in DWG/DXF files: we need to have a part of the network as network inventory object, and not just a graphic background, to be able to connect the projected network. To achieve this, we use the “Data import from Dxf/Dwg” function. This saves us a lot of time and we do not have to redraw anything manually.
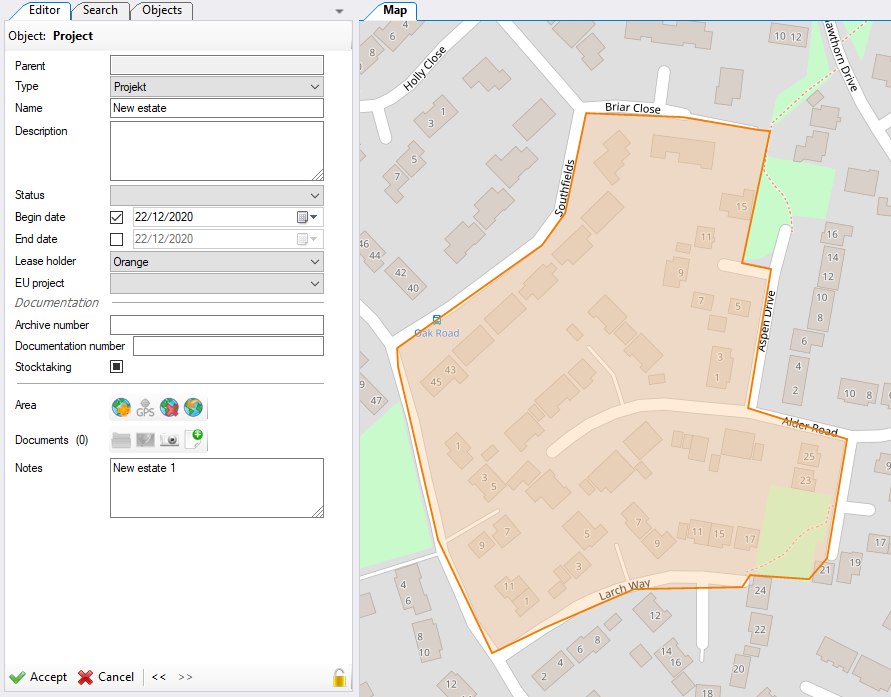
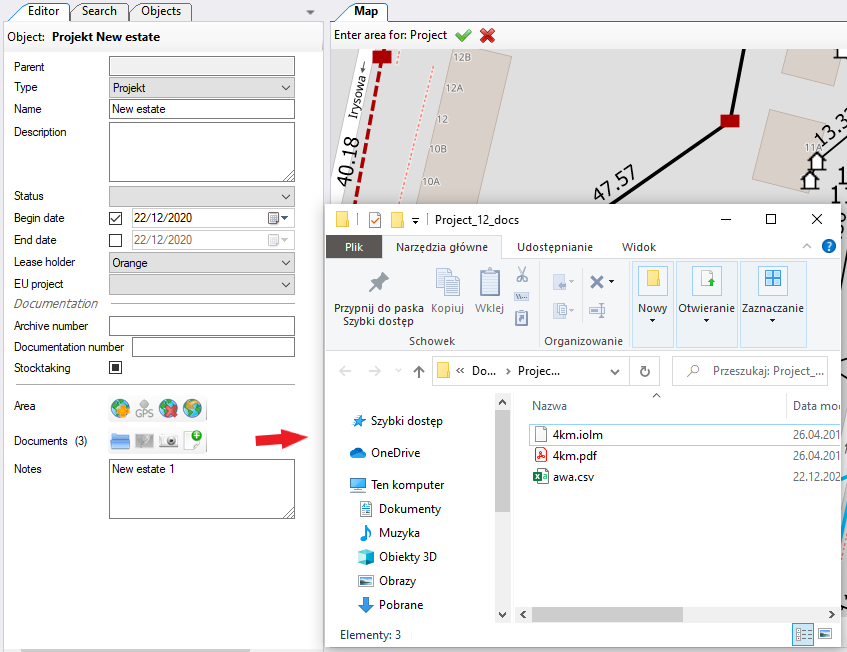
When using other sources as a map background or importing data, we get the context in which we can start designing. For this purpose, the program sets up a project that will connect the whole created network and information related to it. The “project” object can be divided into smaller projects, which allows the work to be distributed among several designers.
Each project has its area coverage on the map, its start and end date, its status, and the information necessary to manage the network development work.
Network concept options
NetStork allows you to save different options of the network concept, which allows you to go back to previous versions and decide on the best one.
Apart from drawing the route on the map, the documentation requires additional notes or remarks, which will also be visible on the printout. It is possible to add notes as comments anywhere on the diagram or map or to draw arrows or links.
The configuration of the style makes it possible to create a proper visualization of the network. The designer can change the color, type, or thickness of the line according to the purpose of the network or the attributes of the created sewage system or point objects. The designer can also select appropriate graphics or icons to ensure a consistent appearance of the created network.
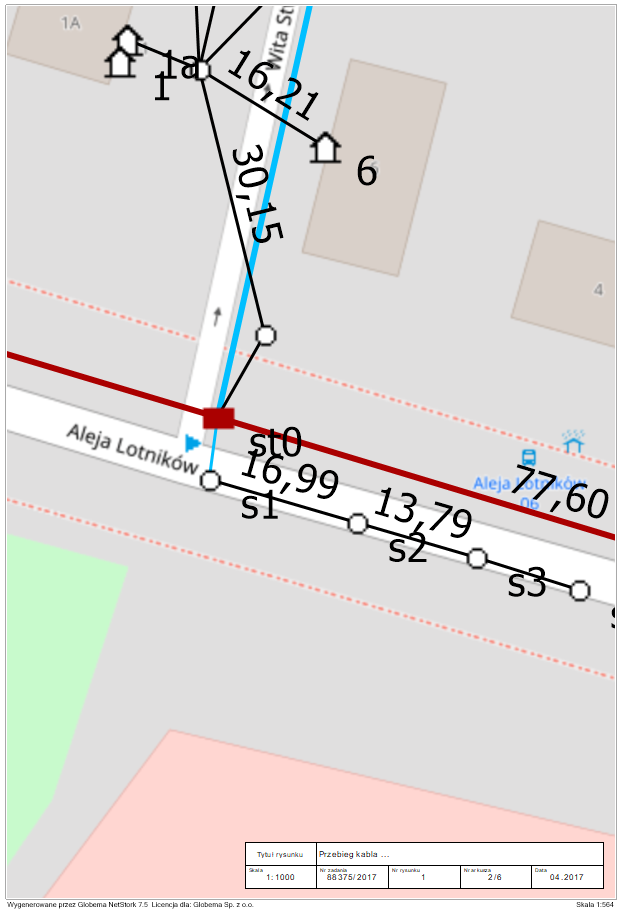
The placement of wells, poles, or other point objects can be precisely determined by reading the current cursor coordinates on the map. Distances are automatically calculated based on the coordinates and visualized on the course of the created infrastructure.
The finished project can be printed together with the necessary metric as a table.
The next step
Designing infrastructure on a map is the first stage. The second stage is the design of the cable and fibre distribution.
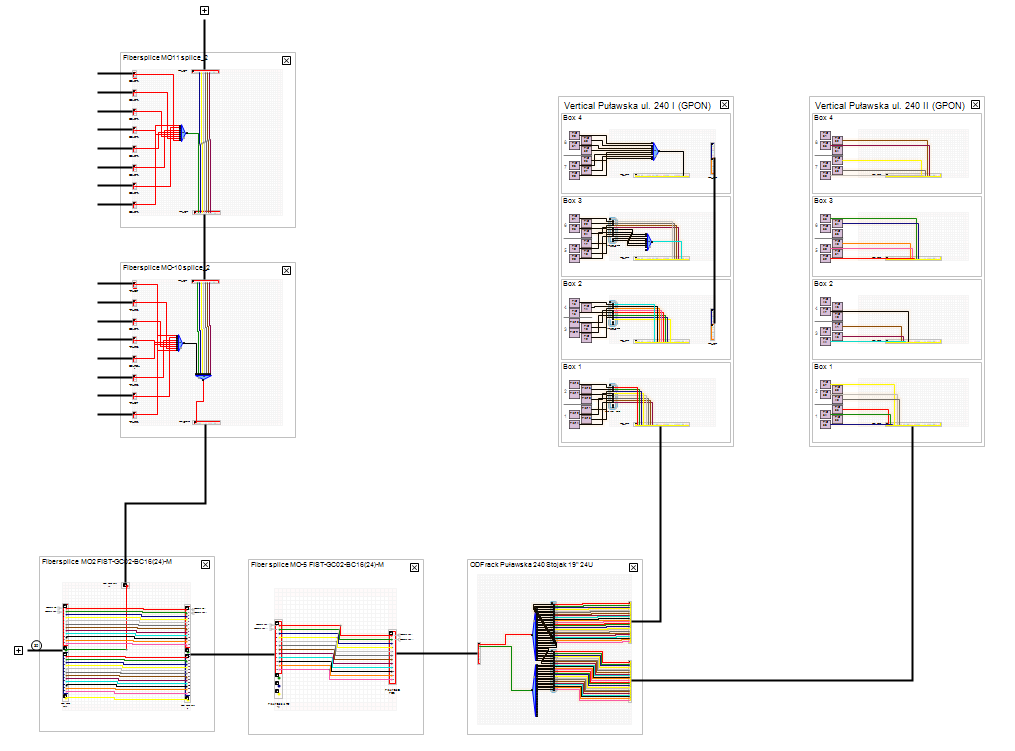
NetStork provides a graphical interface for creating diagrams of couplers and connections in couplers. It is important that such diagrams created in the network inventory system allow you to verify the course of the merged fibres by displaying the relation created in this way on the map. Thanks to this, we immediately know whether the designed connections are correct and create a complete connection path between two points in the network. This is important because later on, the scheme designed in this way will be the basis for the field worker to cross the cables.
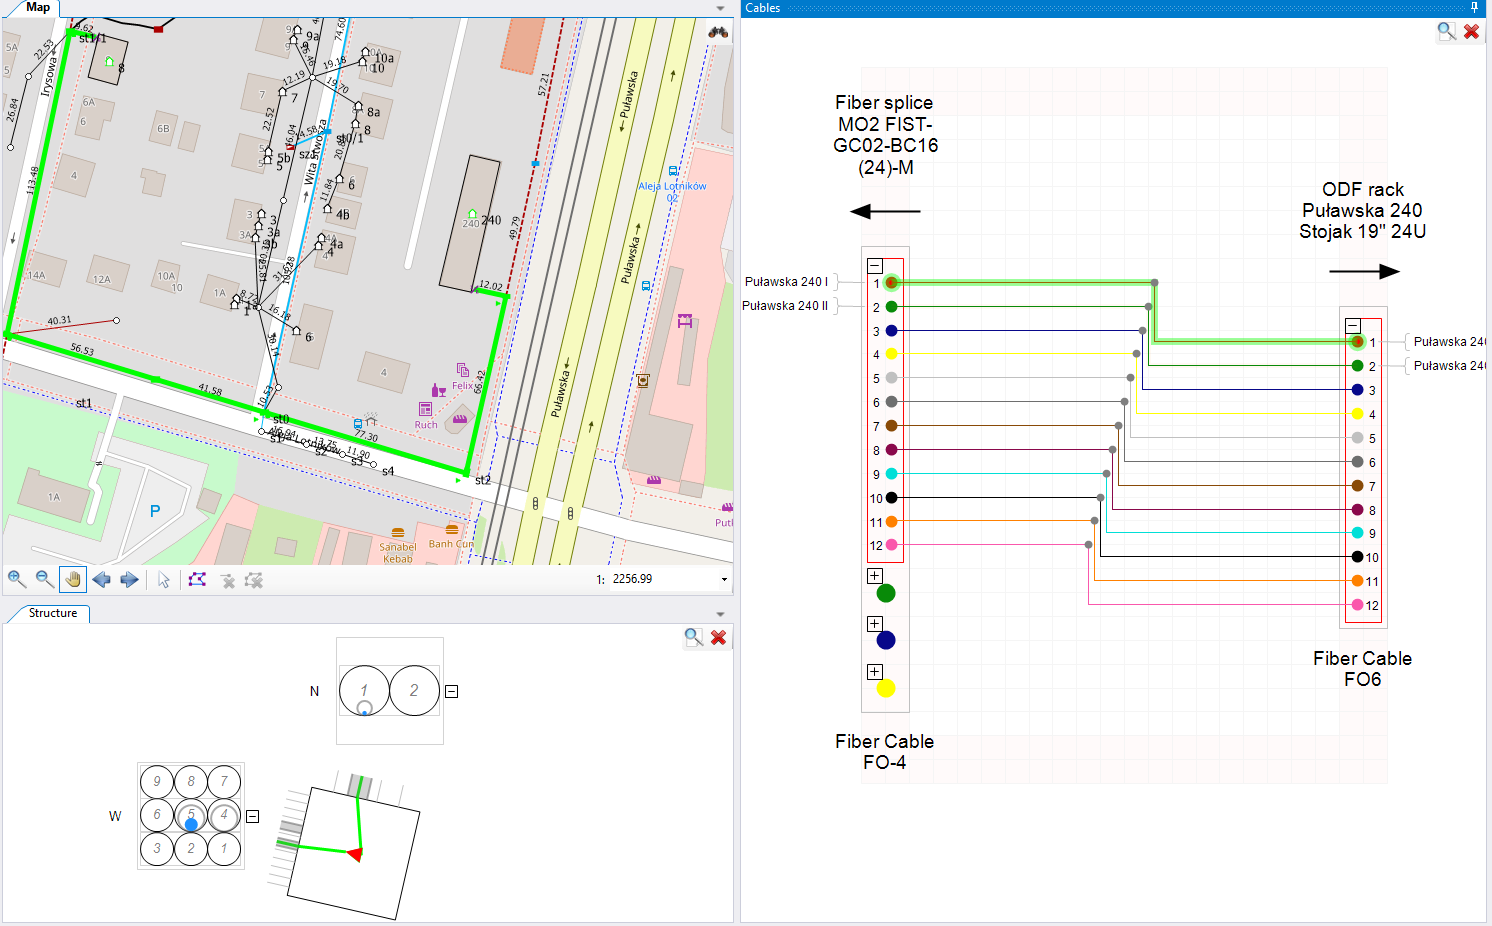
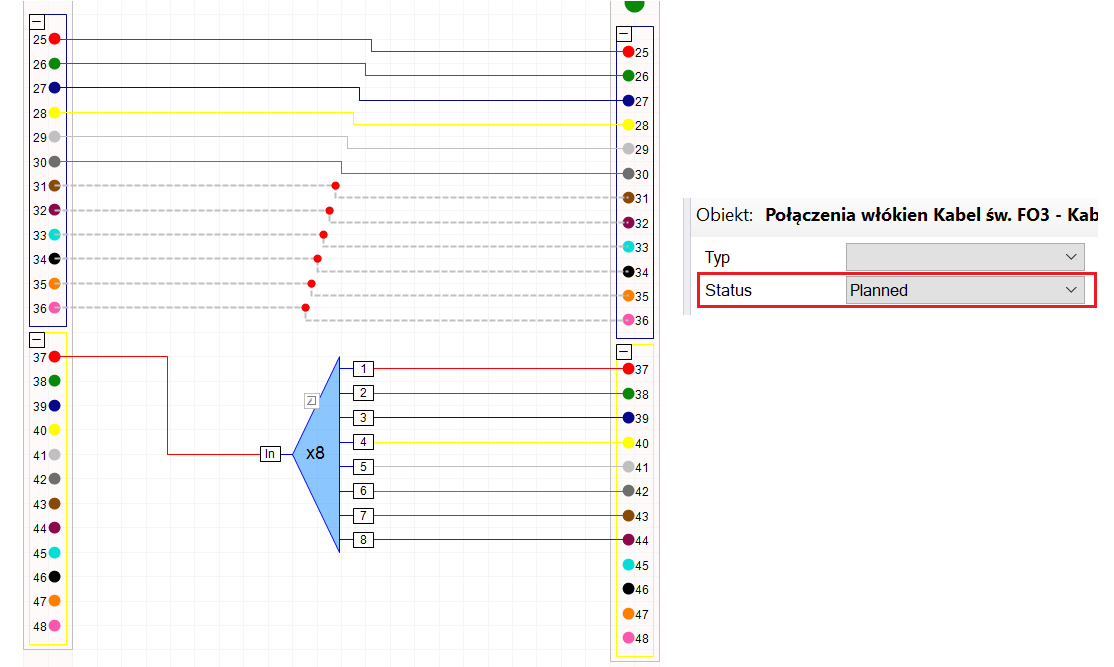
The tracking functions allow you to quickly verifythe designed connections. When you click on the individual fibres in the coupler or ODF, you can see the highlighted route of each fibre on the map.
The interconnection project is not just a scheme that gives topological coherence. Each of the network elements, such as cables, socket weldings, ODF connectors, spliters, and many others, provide attenuation for the signal. Thanks to this, its level in the subscriber’s socket is lower than the level on the OLTa port. The designer must design the network in such a way that the attenuation it introduces is not higher than in the design assumptions.
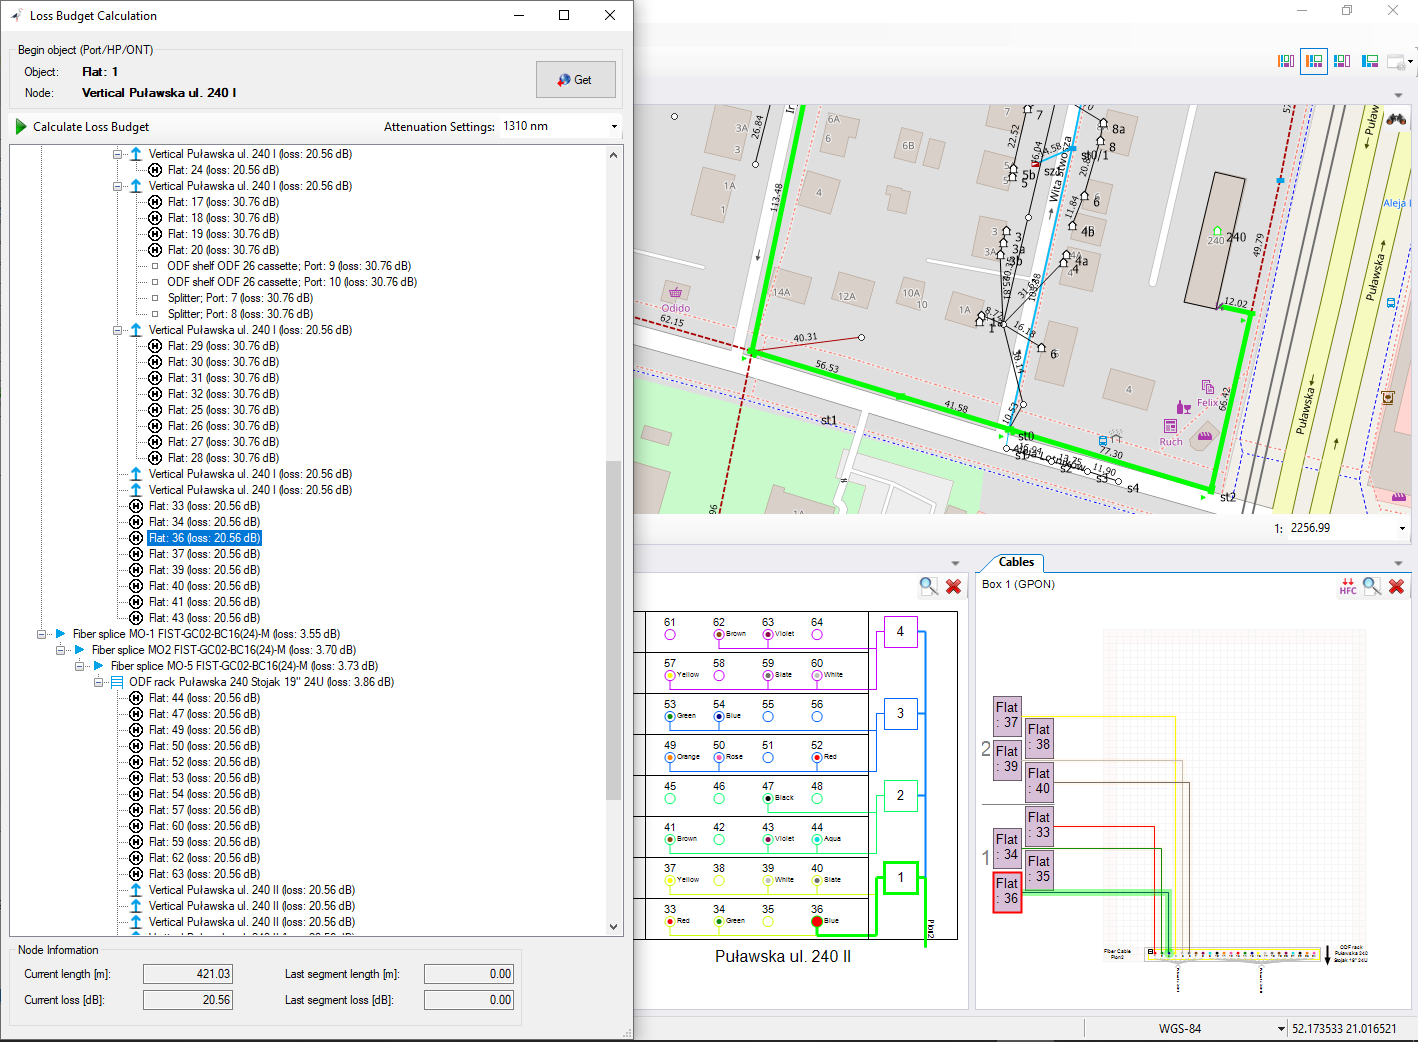
Netstork calculates the level of signal attenuation power and shows it for each connection point in the network. This ensures that the designer always has control over his project without the need for tedious calculations. But that’s not all:
- NetStork has ready-made functions to connect cables and verify their continuity if there are many connections.
- You will also find functions that allow you to search for specific connections and display them on a map.
- When making connections, you will see what signal attenuation each of them will introduce. The optical power balance will include attenuation for cables, splices, splitters, and other components. Remember that the signal quality of the customer depends on the attenuation power!
- The designed logical network (cables) will be located by the network inventory program immediately in the appropriate infrastructure, including sewage system or overhead network.
- The couplers will be immediately connected to the infrastructure objects, such as wells or poles. Each of them will also have a modeled flow scheme.
Project documentation
A lot of documentation is created and collected during the whole design process. The documentation in the form of various files, scans, or photographs can be connected to the “Project” object or to individual network elements. The documentation collected this way is always available in one place and easy to find.
For the purpose of visualizing larger parts of the network, logical and straightened infrastructure diagrams are used.
The logical scheme gives an extension of any object where fibres (e.g couplers or ODFs) are joined by subsequent couplers or ODFs. In this way, you can see the connections for several such objects on one scheme.
A straightened infrastructure diagram gives you a view of the network without the map context as a connection of the network’s physical nodes together with a visualization of cables, sewage profiles, and distances between nodes.
Each scheme in NetStork can be extended with additional notes inserted in the scheme view.
The finished project can be printed or sent as an attachment.
The designed network no longer requires migration or transfer to the network inventory system.
Benefits
With the development of network inventory systems, you get much more than just a structured network. With NetStork you also gain:
Access to information about the network in one place from the design, through construction, to ongoing maintenance.
Significantly lower documentation and inventory costs.
Less work after completion and acceptance of the network.
Contact us for a demo that will show you the most important functions of NetStork and the benefits of using the network inventory system.